
Your figures in real time, in front of you, all the time
By Nicolas Lemielle, Director of DigiWall ·
From Wallify version 1.12, a dashboard screen can be activated on your environment. It is connected directly to your production database: everything is displayed live, with no exports and no re-entry.
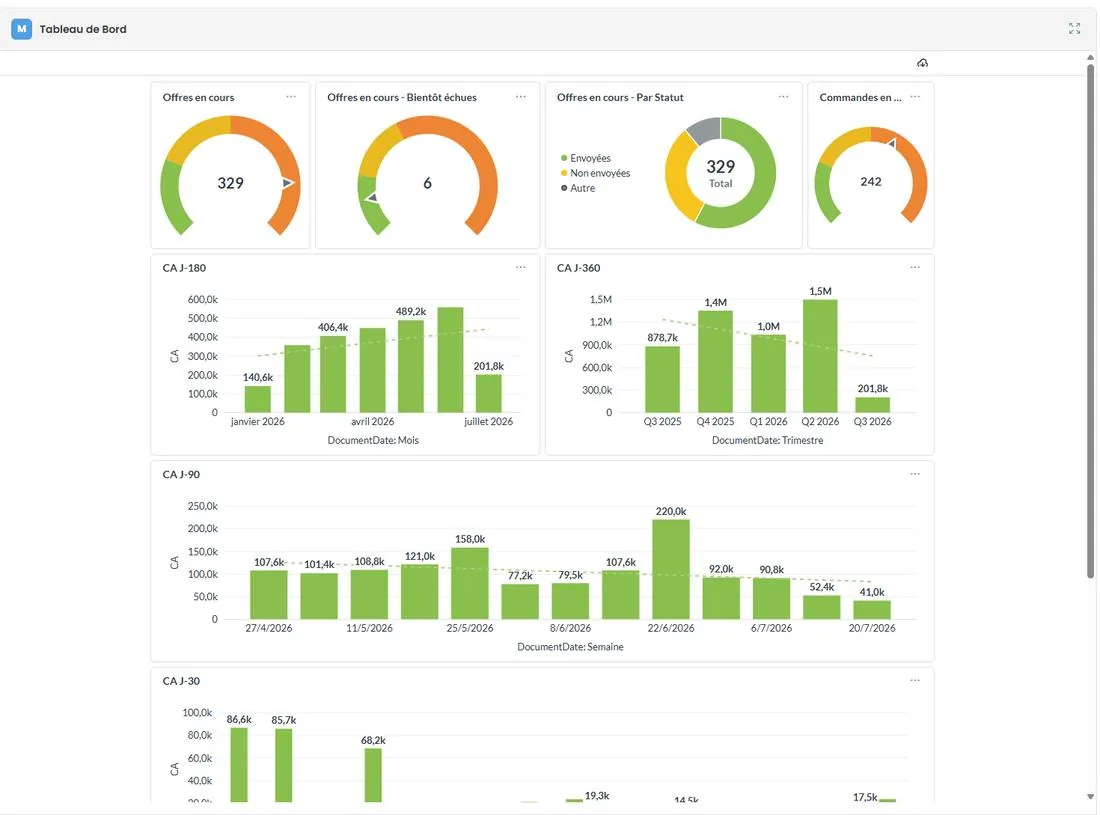
We offer you a core dashboard with around ten tables focused on your revenue : revenue at 30, 90, 180 and 360 days, open quotes, orders… Immediate oversight of your business, as soon as it is activated.
Alerts that lead to action
Some tables flag the situations that need attention, uninvoiced delivery notes, for example. One click on the line concerned opens the document directly in Wallify.
Tailor-made tables, on request
Beyond the core dashboard, we complete your screen with tables suited to your case: filterable by period, by customer, by item type… and exportable to PDF instantly.
A few ideas for tables we can set up for you
Revenue by month and by region · Customer revenue over 12 months · Customer revenue by month with year-on-year comparison · Top 10 drops in customer revenue over 6 months · Customer revenue ratio · Customer revenue by account manager · Customer revenue by delivery method · Customer revenue by item family and sub-family · Customer margin against revenue · Periodic sales by sector
Percentage of outstanding customer orders · Top 25 outstanding · Ratio of quotes won over 12 months · Open quotes expiring soon · Latest customer records created · Weekly volume of records created by origin · Latest documents created
Total overdue by customer (> 5 days) · Total overdue by due date (> 5 days) · Uninvoiced delivery notes · Orders undelivered for more than 3 months · Peppol documents with a failed response · and many more…
In practice
Module based on Metabase technology, whose licence is spread across all deployments.
Core dashboard (around ten tables): €60/month + one-off setup estimated at 3 hours of work.
Additional tailor-made tables: on request, depending on your needs.